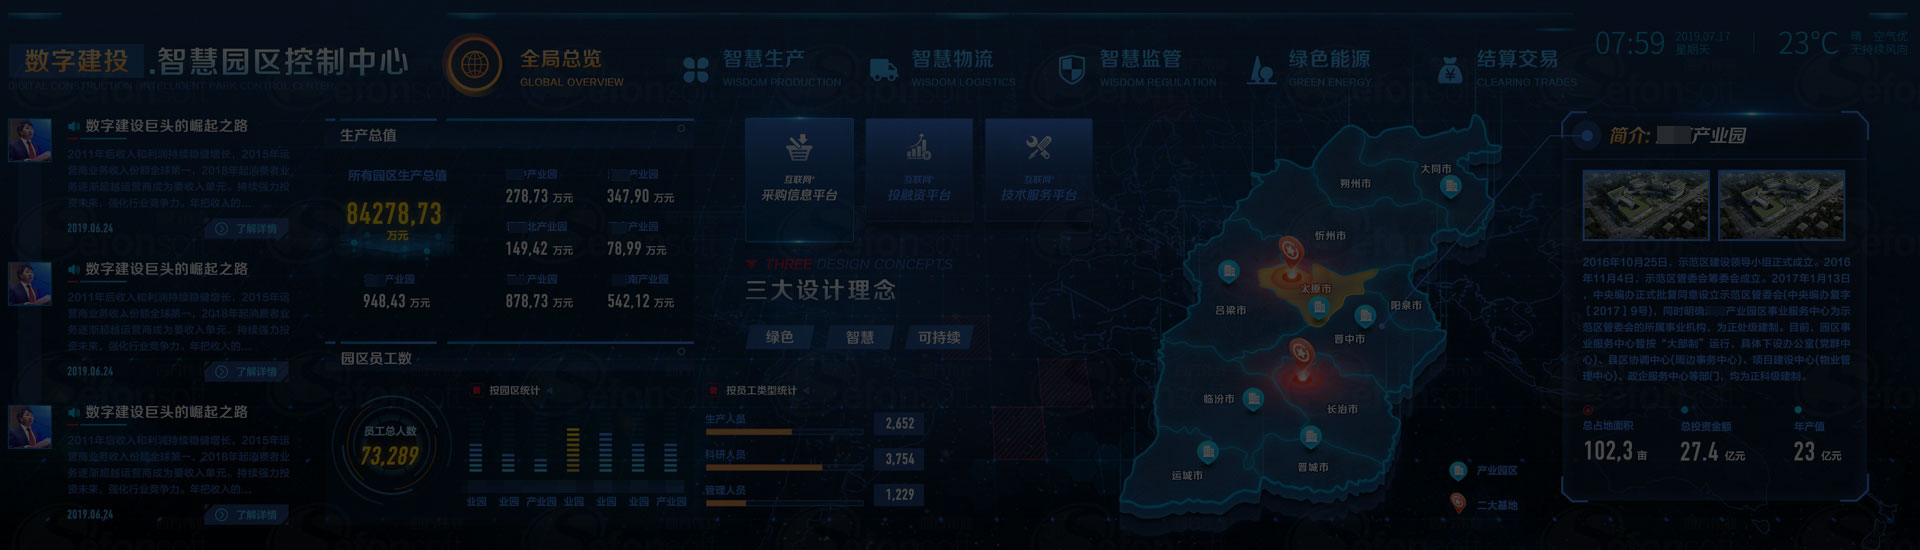
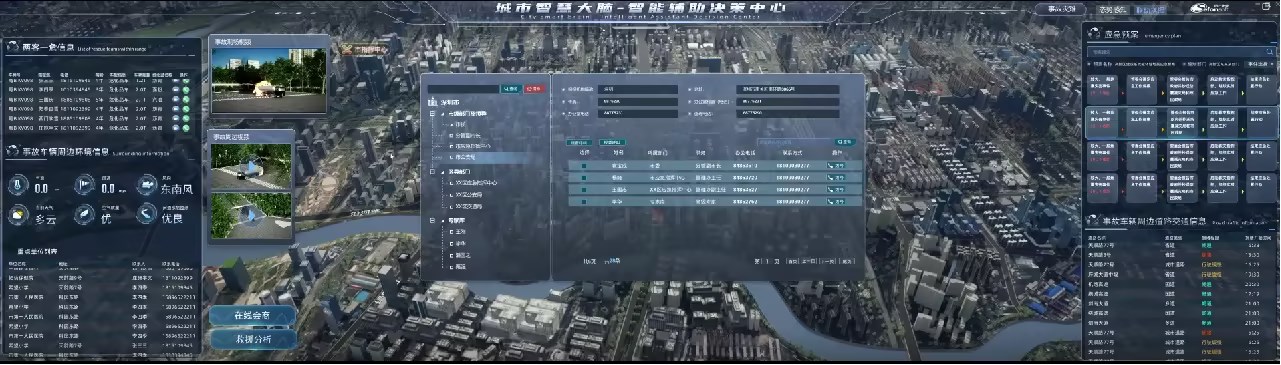
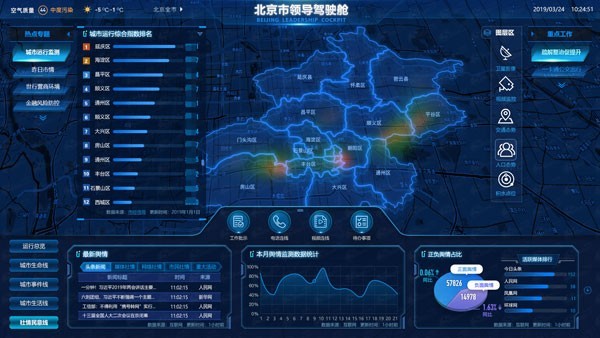
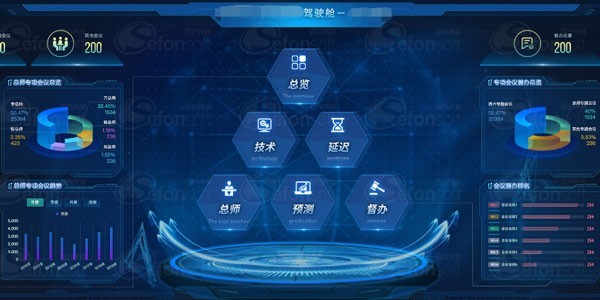
Leadership Dashboard
As Smart City IOC projects advance across major cities, a variety of visualization applications have emerged. However, client requirements have shifted from pursuing flashy visual effects to seeking practical application value. The Leadership Dashboard applies scenario-based thinking to scientifically organize decision-making elements, helping leaders efficiently, objectively, and comprehensively “see the indicators they want to see.” By establishing data relationships and deeply mining data potential, it also allows decision-makers to “see the problems they hadn’t noticed.”


 Copyright ©Chengdu Sefon Software Co.,Ltd.
蜀ICP备14024109号
Copyright ©Chengdu Sefon Software Co.,Ltd.
蜀ICP备14024109号